Quick VI Analyzer


I haven’t talked a whole lot about VI Analyzer yet. It’s a static code analysis tool. If you come from text-based background, it is similar to a linter. It checks your code against a set of predefined rules and reports back any violations. You do need LabVIEW professional for this and it is a seperate toolkit to install. If you want to learn more about VI Analyzer itself, I recommend Fab’s book. I want to talk more about some of the challenges in using it and how I use it.
Why VI analyzer?
Typically when people are using VI Analyzer, they are trying to accomplish one or more of these three things:
- Clean Code – You can use VI Analyzer to help you write cleaner code that is easier to read. VI Analyzer alerts you about things like wires that run underneath things or backward, or objects that are hidden.
- Enforce Style – If you have a style guide, you can use VI Analyzer to enforce many of the rules and make sure that everyone is following them. This is similar to the clean code motivation but in this case the motivation is more about standards and compliance.
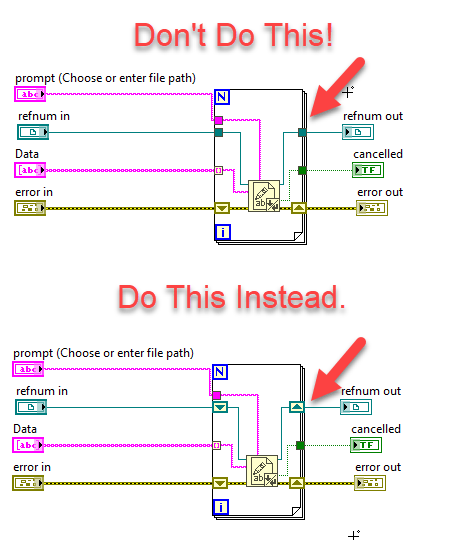
- Find Bugs – Fab is really big about promoting VI analyzer for this. There are certain classes of bugs that you can find with a simple VI analyzer test. An example is passing a reference through a for loop with a regular tunnel instead of a shift register.
Problems with VI Analyzer
There are some problems that can arise when using VI analyzer
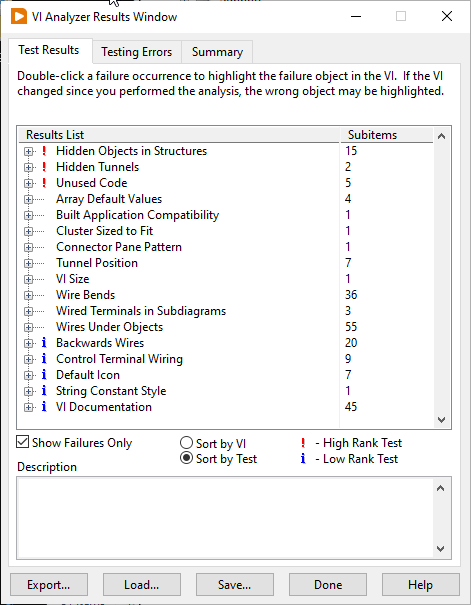
- It can be noisy. With its default out-of-the-box configuration, VI Analyzer can be very noisy. Even well-written clean code will probably generate a lot of failures with the default config. So it requires some careful tuning. There is no real standard here, every organization comes up with its own unique settings. One way to deal with some of the noise is with #via_ignore tags.
- It requires careful targetting. People often run VI Analyzer on their entire project. While this is good, in that it catches everything, it does presents 2 problems:
- The more VIs that are tested, the longer the test takes. This can be very wasteful if the VIs haven’t changed since the last time they were tested (and we have already addressed all the issues).
- It encourages people to step outside their lane. When using SCC each person should really only work on one part of the codebase to avoid unnecessary merge conflicts. Running VI Analyzer on the entire codebase encourages them to step outside their lane and fix problems outside their area, which can cause merge conflicts.
- Simply running VI Analyzer can be time-consuming. Running a full suite of VI Analyzer Tests on even a small project can take a long time. There are 3 variables that affect this.
- The sheer number of tests
- The number of VIs being tested
- The time requirements of each test. Some tests execute very quickly and some take a little longer. Tests can also have configuration options that can make them run faster or slower.
- Not all tests should be run on all VIs. The things you care about on a UI VI that the end-user is going to see are different than the things you care about in a subvi.
- The results can prove unreliable. What do I mean by that? You can end up with tests that pass on one computer, but not on another. It’s not VI Analyzer’s fault. It has to do with fonts. A lot of the VI analyzer tests check to see if 2 objects overlap. Well, if they have text in them and the font changes, they may resize, which then causes a different test result. There are ways to mitigate this with careful font selection and specifying fonts in ini files, but it is still a pain and something to be aware of.
Partial Solution
So how can we can take advantage of VI analyzer and avoid some of the downsides. If you run VI Analyzer from the Tools Menu you get a very fancy GUI. However, there is an API for programmatically controlling VI Analyzer and setting up tests. VI Analyzer is very flexible. You can make your own custom tests, and you can set up priorities and output a report so that your CI can determine when to fail the build based on which tests failed. You can also tag VIs and run different tests based on the tags. I am going to share with you a simple little tool that I have been working on lately. It doesn’t get into all the fanciness that is possible, but it is what I have been using and it seems to work. It avoids many of the downsides I pointed out above. I am a solo developer, so understand that what I do may not apply in your situation.
Motivation
My main motivation for this tool is to make the tests run faster. I was running them as part of my CI and I want my CI down under 10 minutes. Running VI Analyzer alone (with my tuned set of tests – which was fairly inclusive) was taking 12 minutes. This was on a medium-sized project that was in its infancy so it was only going to get worse. I was running it as part of my CI process but wasn’t failing the build. Just reporting the results. I also realized that running VI Analyzer should be a more interactive thing. That is to say, that running it at the end and tracking metrics is fine, but it would be nice to fix issues as they come up.
The other issue was more a philosophical one for me than a practical one (only because I am a single developer). I often found that while working on a feature I would run VI analyzer on the project and it would flag VIs that I hadn’t touched. These had preexisting problems that hadn’t yet been resolved. Now I could go and fix those, but then that would involve changing code outside my lane. Now since I am a solo developer, not as big of a deal, since there no other toes to step on, but in a group that could easily be a problem. I could also easily see it being a problem for dealing with legacy code.
Paring Down The Test Suite
I am mostly running VI Analyzer just to catch anything I might have missed such as something ending up under something else accidentally, or where I forget to add VI documentation. For this to run quickly, I pare down the tests. Because I am a solo developer I can get rid of many of them. For example, the test for global variables. I know I am unlikely to abuse them, so that can go. The rules that stay are ones I am likely to break, or where breaking the rule would cause real problems. I also keep tests for things that would be hard to catch just from glancing at the code. So I come up with a minimal test suite. Yours may vary from mine.
NOTE: There is nothing keeping you from having multiple VI Analyzer config files. I have one pared down one for day-to-day use for quick tests and then a more comprehensive one that I can run before I make a release.
Getting Changed Files From Git
Paring down the number of tests, speeds up the test suite, but there is more we can do. I really only want to run it on the files that I have actually changed recently (ie the files that have changed in my local commits). This serves 2 purposes: 1. It speeds up VI Analyzer because there are less VIs to test, but it also 2. keeps me in my lane and helps avoid unnecessary merge conflicts. If I have already changed a specific VI, then it is either going to have a merge conflict or not. VIs are binary, so merge conflicts are only determined by if 2 people made changes to a file, not what has actually changed in the file. If I clean it up, that is not going to affect whether I have a merge conflict or not.
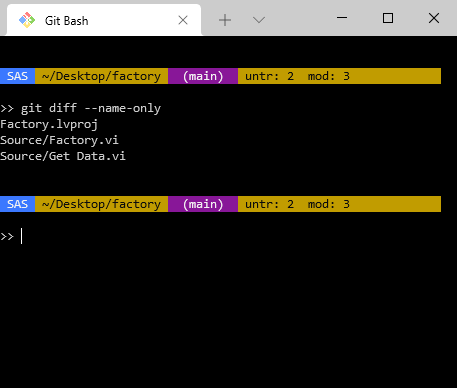
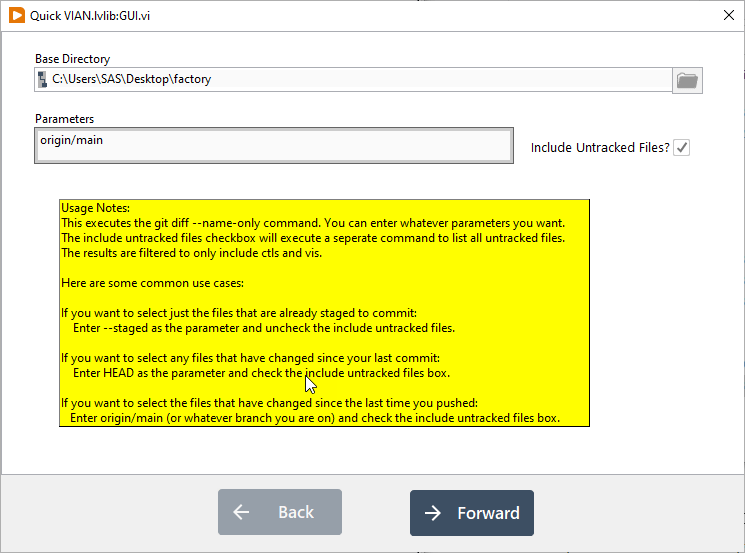
Luckily we can get the information from Git about which files have changed. The git diff --name-only command will list files that have changed in the diff.
You should browse the help for the git diff command to make sure you understand exactly what it is comparing. It is not always obvious. There are a couple of parameters to the git diff command that make sense depending on your situation.
- No Parameters – With no additional parameters,
git diffjust shows you the changes to your working copy that have not been staged yet. These are things that you could add to your next commit, but haven’t yet. This is generally not what you want. --staged– This option only shows you the changes you have in the staging area. It shows you what you are about to commit.HEAD– This option will show you everything that has changed since your last commit, whether it is staged or not.HEAD~1– You can add a ~ and a number to go back that many previous commits.origin/main– If your remote is named origin (the default) and you are on the main branch, this will show changes that have not been pushed to the server yet.
Depending on your exact situation, any of these may make sense. If you are performing the cleanup as a separate step before you make a commit then --staged or HEAD makes sense. If you do a seperate cleanup commit before you push, then origin/main makes more sense.
Untracked Files
One thing to keep in mind about all the git diff commands only return changed files, not untracked files. The –staged option is an exception and will return untracked files that have been added but not committed yet. If you are using one of the other options and want to run VI Analyzer on untracked files, you will have to get that list separately. There is a separate Git command to show all the untracked files and that is:
git ls-files --others --exclude-standard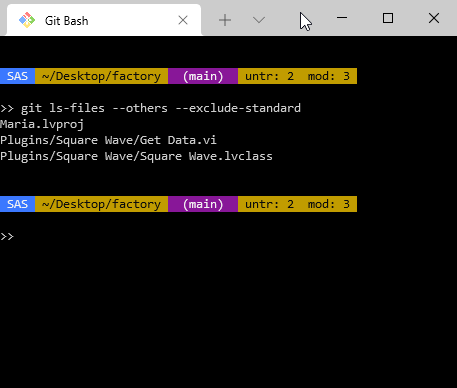
Deleted Files
Another thing to keep in mind is that these commands will return deleted files. No sense in trying to run VI Analyzer on a file was deleted. So you want to make sure to filter whatever list you collect to make sure that each of the files actually exists in your working copy.
Only Analyzing Specific Files
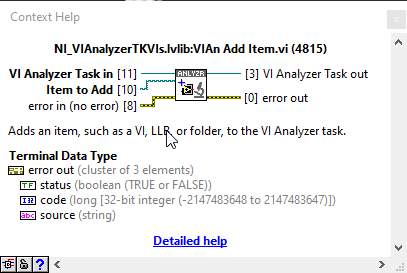
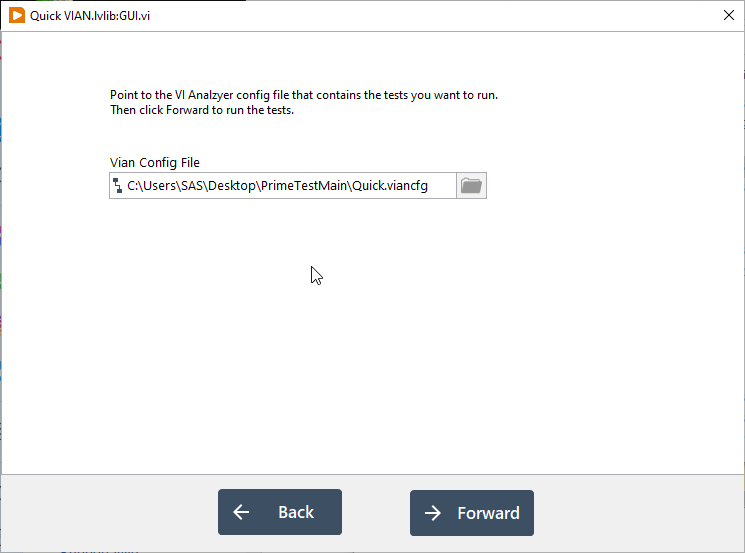
The VIAN API makes it easy to add files to be tested. You can start with a .viancfg file that lists the tests you want to run and where the list of items to be tested is empty and then programmatically add all the changed files that you got from Git.
Putting it all together in a simple GUI
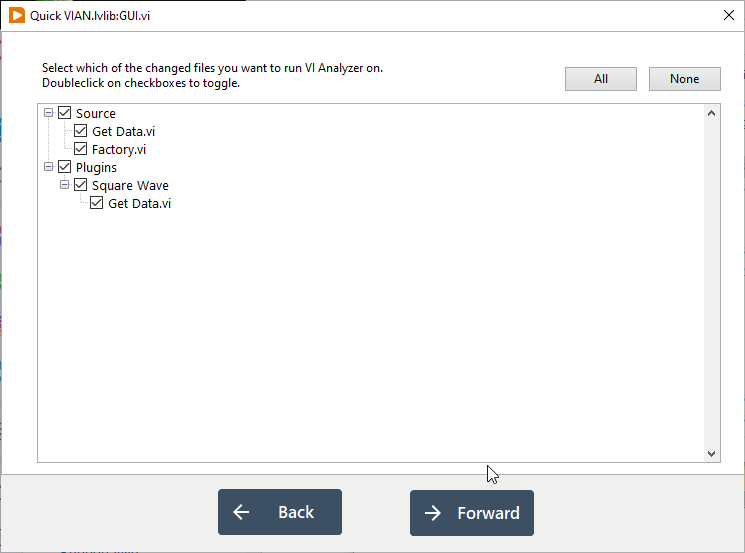
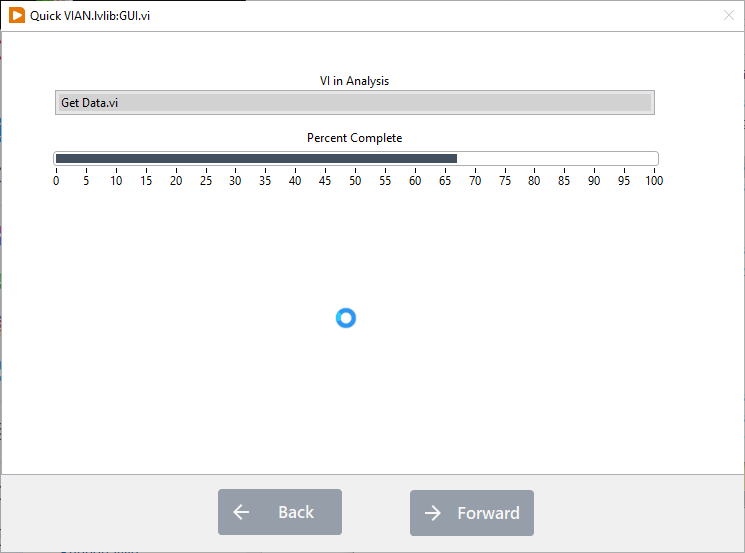
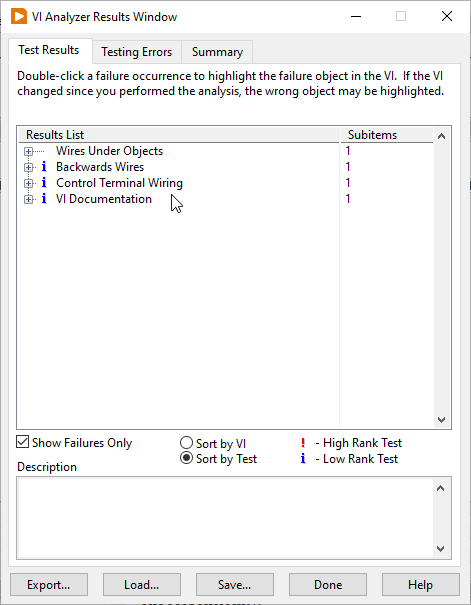
I put all this together into a tool I call Quick VIAN. Its open-source. You can grab a copy at https://gitlab.com/sas-blog/QuickVIAN
Here are some screenshots:
A word on failures
100% Compliance is a lot like 100% Test Coverage, it sounds great but is not necessarily a great goal. Your approach should depend on what you are using VI Analyzer for. If you are testing to catch bugs well then you may very well want 100% Compliance on those particular tests, but you don’t necessarily need 100% Compliance on the rest of the tests. You can use #vian_ignore in those cases, or you can use test priorities to decide which test failures should fail your build. You could also have 2 separate VIAN config files, one with the tests that must not fail and one with everything else.
For Legacy code where there are already a lot of failures, adding a limit can be a useful technique. Run the VI Analyzer once at the beginning. Take note of the number of failures. Add that into your CI as a limit. If the number of failures crosses that limit, then fail the build. Track it and over time you can lower the limit. The Quick VIAN tool helps a lot in this case because it only shows you the failures in the VIs you have changed. It eliminates a lot of the noise and helps you to stay in your lane.
Running as CI job
You can still have VI Analyzer run a more complete suite of tests on commits as part of your CI suite. As part of my CI process, I run a comprehensive suite on the entire project and track the metrics. I want to start using the test priority to fail builds if certain key tests fail – ie. ones that detect actual bugs, but I haven’t implemented that yet. It is on my radar.
Right now, I just run VI Analyzer as a separate stage. That lets me run my basic CI first, so I get some rapid feedback, and then I have an extended stage that runs VI Analyzer on the entire project and report the results. If the number gets too high then I know I need to take the time to do some cleanup. This technique leaves me with a small CI script that I can still run locally.
Help!
If you would like help improving your code quality by incorporating VI Analyzer into your workflow, let’s talk. Use the button below to schedule a call.
