More GitLab Runner Troubleshooting Tips

I’ve been writing a lot lately about Continuous Integration and using GitLab Runner. It’s really nice when it works and it works 90% of the time, but issues do pop up occasionally. They can be a pain to troubleshoot. I previously wrote about how to run GitLabRunner as a regular user. You should all do that. If you are not, go do that now, you’ll thank me later. But there is more to troubleshooting than just that, so I thought I’d add some more tips here.
Turn on Logs and Reports
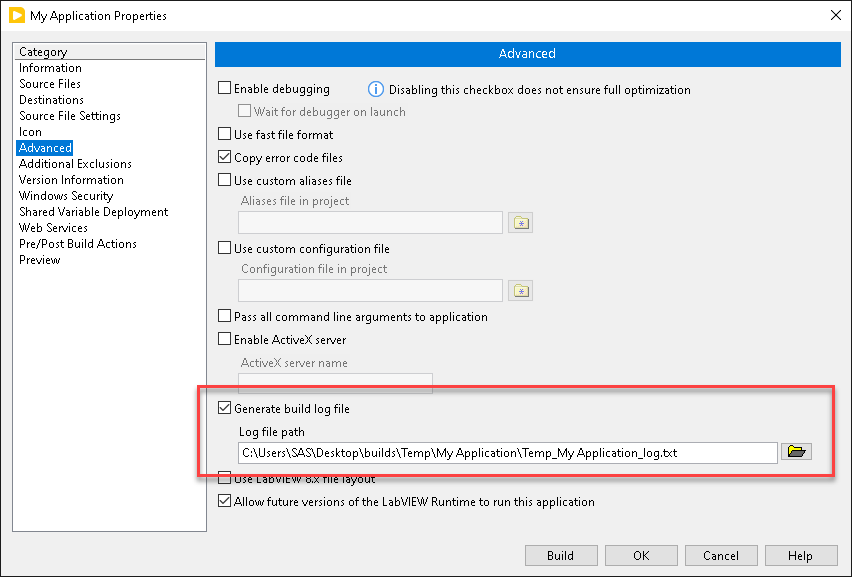
The first tip is to always turn on build logs and unit test reports. There is really no reason not to. It might make your CI jobs take a few seconds longer, but it saves you so much time when things don’t work. If you have the logs and reports turned on and there is a problem, they can often point you in the right direction.
Always Grab Artifacts
Along with turning on build logs and unit test reports, you should always grab them as artifacts (keyword always). This lets you view them from the GitLab web interface without logging into the CI machine. When you declare a file as an artifact, it gets grabbed at the end of the job and archived on the GitLab server. It’s not permanent. It does expire, but GitLab holds onto it for a while. The GitLab help will give you all the relevant information on that. By default, any files created in one stage are carried over to and available for use in subsequent stages. So you don’t have to grab your builds as artifacts in your build stage in order to deploy them in your deploy stage. However, grabbing the builds along with the logs and reports as artifacts will let you store them on the GitLab Server under the associated job. This lets anyone who has access to that job in the GitLab Instance to download them without having to log in to the runner machine and go find them. Having the logs and reports easily available on the server also makes troubleshooting easier.

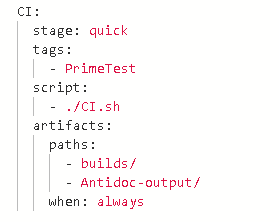
When I say always grab artifacts, that means you need to include the following yaml code (see below). The reason that is needed is that by default GitLab CI will only grab artifacts if the job succeeds. Now for builds, you probably only want the build if the build succeeds, but for logs like build logs or unit test reports, they are most valuable when the job fails. If you include this always clause, those logs will always get grabbed and stored on the server.
Troubleshooting Using Logs
For some reason I tend to get a fair amount of build failures and unit test failures. Usually it passes on my machine but fails on the server. There are a variety of causes. Often it is missing or broken VIs. I’ll add a new dependency by referencing some new VIPM package and forget to update my vipc file, so the package is not on my build machine and the VIs show up missing. Sometimes I’ll add method to a class or library and save the method but not the class/library. So the new file shows up on the build machine and claims to be part of the library, but the library doesn’t know about it, because it didn’t get updated.
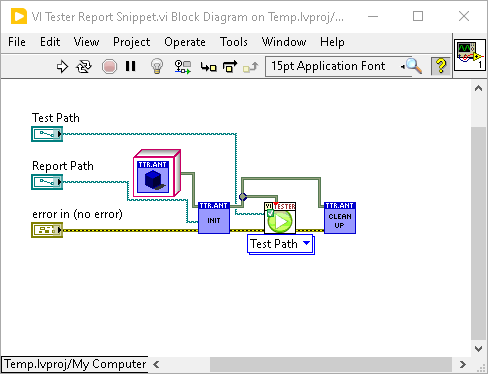
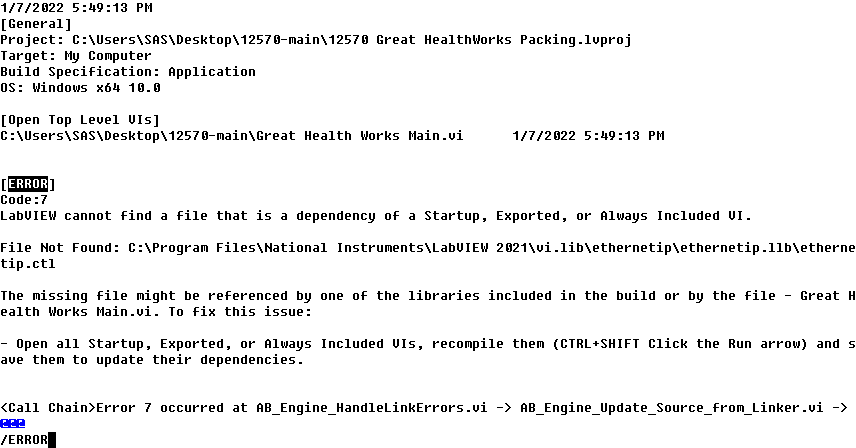
If you follow the above steps of turning on build logs and unit test reports and always grabbing them, then these issues can be easy to troubleshoot. You’ll get an e-mail from the server that says your pipeline failed. It will have a link that will take you to the page for the pipeline. From there you can get to the artifacts. If it is a failed unit test, VI Tester generates detailed enough reports that I know where to look. Sometimes the problems make it through the Unit Tests somehow and show up at the build job. In that case searching the build log for [ERROR] will point you to the VI that is causing the problem.
Once I have identified the broken VI, then I go to my dev machine. If I still have the project open I save all and check my Git status to make sure that I checked everything in and don’t have uncommitted changes. If I have no uncommitted changes, the VI doesn’t have a broken run arrow, and the tests and builds pass on the dev machine, then I check to make sure it opens and everything works on my build machine. Somewhere in there I usually figure out what the underlying problem is and I’m able to fix it and check everything in and run a new CI pipline and it all works.
Dependency management
This brings us to dependency management, since lack of it can often cause these types of CI failures. You need to find a way to get a handle on that somehow. There are a variety of ways of managing dependencies. There are submodules and subtrees in Git. You can also use NIPM or VIPM. I personally use VIPM. The goal is to have some file in your repository that references all the stuff you need and have a way on your CI machine to read that file and make sure everything is up to date. VIPC files fit that bill. It’s basically a list of all the packages you need with the corresponding versions. VIPM has a LabVIEW API. That allows to add a step to your CI process to apply the VIPC, which installs all the correct packages. Then the only thing you have to remember to do, is if you add a new dependency, you have to add it to the VIPC. Then when you push your changes, the new VIPC will be applied on the CI machine and all will be well. If you have no VIPM dependencies you’ll need to find a different way to track those and keep those up to date. Depending on how often they change, updating them manually may work, but I always look for and take advantage of automated solutions.
Timeouts
There are several levels of timeouts when using GitLab CI. The failure e-mail you get and/or the web interface will tell you which type of timeout you are facing.
Timeout waiting for Runner
Sometimes a job will timeout while waiting to be picked up by a runner. This can happen for a variety of reasons:
- A runner exists and is properly registered and tagged, but the runner is occupied on another job. If you are sharing runners across projects, this can easily happen. If the runner is hung on another job, it should eventually timeout. You can just rerun the job and when the runner becomes available it will pick it up. If you run into this problem often, the solution is to create another runner. If you are using VMs or AWS this just means cloning it and spinning up a new instance/VM.
- There are no runners assigned to the project. Depending on how you have things setup you may have to manually assign a runner to the project. See my previous blog posts on setting up GitLab Runner if you need to setup a new runner. If you have the runner setup for a different project, but not assigned to this particular project, you should be able to add it to your project via the web interface.
- There is a runner available to the project, but the tags don’t match. In that case make sure that the tags specified in the yaml file are met by one of the runners on the project. You can add tags to the runner via the web interface or by manually logging into the runner and editing its toml config file.
- A runner has been defined in the project with the correct tags, but it isn’t currently available. This could mean that the machine is simply not running, GitLab Runner itself is not running, or the machine does not have network access to connect to the server.
Job Timeouts
Once a job is picked up by a runner, you can run into a job timeout. Jobs typically timeout for 1 of 2 reasons. The first reason is the job just takes a while and the timeout is too short. You can set this timeout value per job in the yaml file. You can also set it in the runner configuration, which would apply to all jobs run on that runner (and the smallest value would take precedence). Another reason jobs can timeout is due to dialog boxes. If one of the script steps in your job launches a program like LabVIEW or VIPM and it’s stuck on a dialog waiting for user input, your job will eventually timeout. In that case you may have to login to the CI machine and manually resolve the dialog. G-CLI is good about setting LabVIEW flags to avoid that but nothing is perfect.
Individual Script Step Timeouts
Sometimes an individual script step will timeout and pass out an error which will stop your CI job. Sometimes these are caused by dialog boxes, sometimes its just a spurious thing where Windows is off doing something else. For G-CLI and the VIPM API there are flags that set the timeouts. You can adjust those. Sometimes I just set an environment variable at the beginning of my script as a default timeout and use that. Then I can always finetune the timeout for an individual step if I need to.
Display Timing Info
One useful tool for debugging timeout issues to is to display elapsed time for individual script steps and for the overall script section of your job in the terminal. You can do this from within LabVIEW and use G-CLI to output it to the terminal. You can also do it directly in bash. Doing it in bash is more complicated, but the advantage is that your elapsed time will take into account the time it takes to launch LabVIEW. If you are creating custom G-CLI commands I suggest you build something in to output the elapsed time at the end. This can be really helpful for troubleshooting.

Setting GitLab Timeouts
There are several timeouts that can be set in GitLab. These are above and beyond any timeouts you implement in any script steps.
They are:
- Project Level Timeout – This is defined in the web interface and applies to all jobs in the project.
- Job Level Timeout – This can be defined on a per-job basis in the ymal file.
- Runner Timeout – This is defined in the toml config file in the runner.
Honestly, GitLab timeouts interact in weird ways and can be hard to understand. Consult the GitLab help or one of many threads on Stack OverFlow if needed.
A note on setting timeouts
It may be tempting to just set really long timeouts, but remember that our goal with CI is to get quick feedback. If a job normally takes 5 minutes and suddenly takes 20, it’s probably failed and we wouldn’t want to wait several hours to find that out. Generally if something suddenly takes a lot longer than normal, that is a problem and something you want to know about and investigate. The answer may end up being to increase the timeout, but generally a better answer is to figure out why it’s suddenly taking so long and fix that.
Retrying a Job
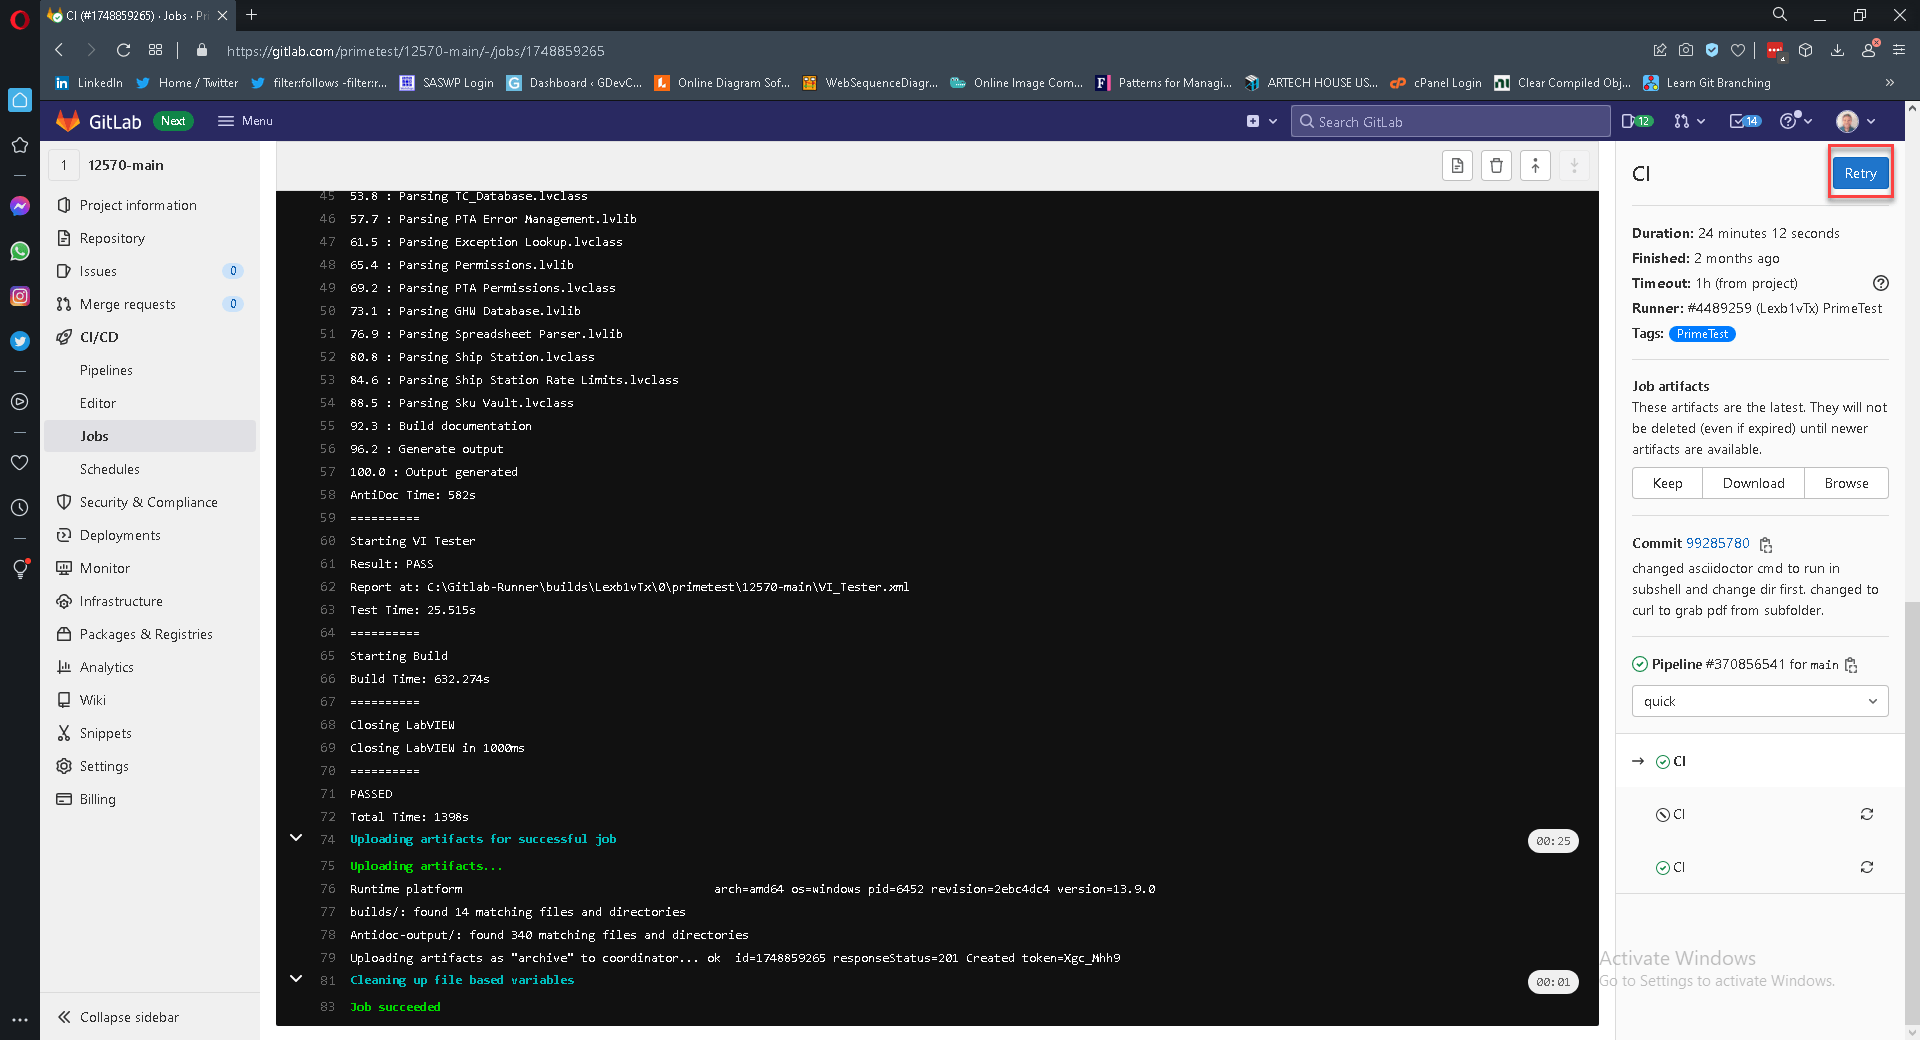
Sometimes simply retrying a job will solve your timeout issues (and sometimes other issues as well). You can do that from the web interface. This often one of my first troubleshooting steps. Although when it succeeds it never leaves me with a warm fuzzy feeling. I like to do a little a investigation to figure out what caused it. However sometimes if the timeouts are set close to the actual typical time required for the job, it is really just Windows jitter. This is where tracking elapsed time can help. If you output the elapsed time, you can go back and look at previous jobs and see how close they came to timing out. If it’s always finishing close to the timeout, maybe you just need to update the timeout value.
Cache clearing
There are various levels of caching going on in this system and sometimes resetting the caches can help.
LabVIEW Cache
If you’ve been using LabVIEW for any amount of time you are probably aware that sometimes the LabVIEW cache can get corrupted. This can happen on your build machine. So sometimes if you are seeing really strange things, clearing the cache can be useful. You can do it manually by logging into the build machine and opening LabVIEW and then using the tools menu. After that you can just rerun the job from GitLab Web Interface as mentioned previously. Note you can also do clear the LabVIEW cache programmatically via VI server – I often include this in some of my CI scripts.
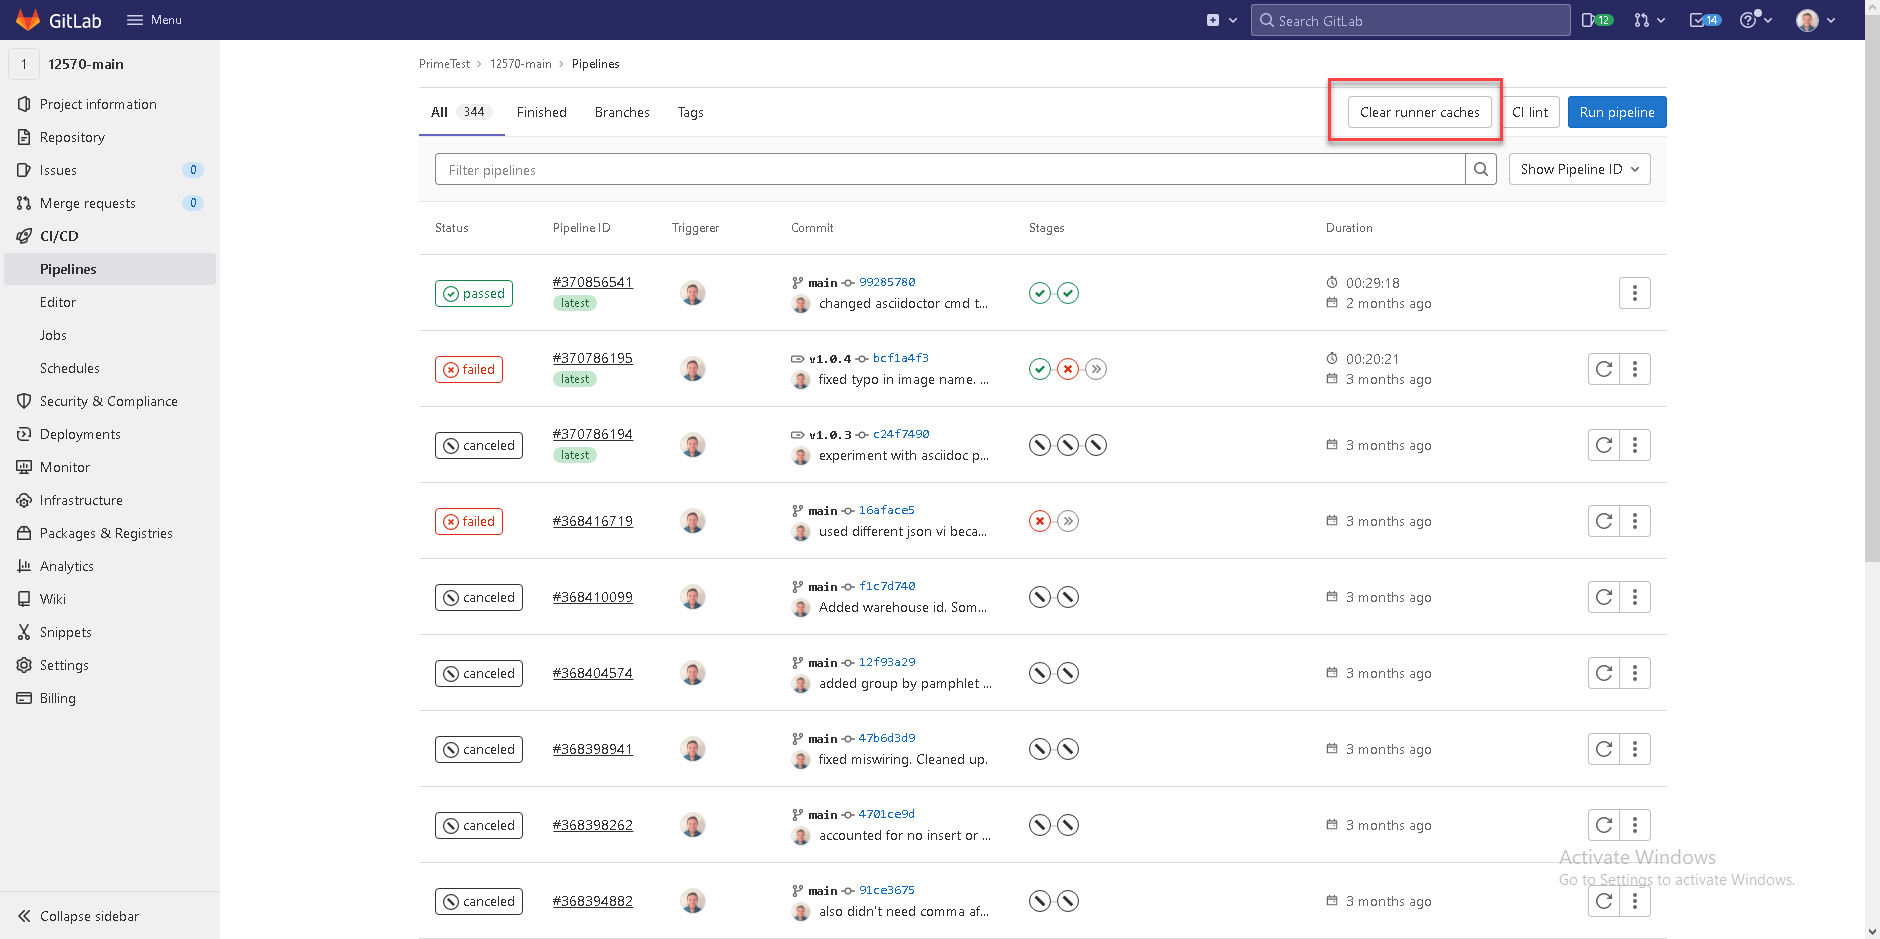
GitLab Runner Caches
From the web interface you can reset the GitLab Runner Cache. (see image). You can also log into the runner and find the repository nested in the GitLab Runner directory and delete that whole folder. The next job will then check everything out fresh from Git again.
Running Jobs Locally
Sometimes CI failures are caused by issues with the build machine, but often they are caused by simple issues in your code (or sometimes in your CI script itself) and can be caught locally. Catching them locally is usually easier to fix and less hassle. Therefore I highly recommend being able to run your CI scripts locally. It may be as simple as running your unit tests from within LabVIEW (which you should be doing anyway), but I like to be able to actually launch my CI scripts from the CLI locally just like the build machine will. This can take several forms. You can write one single bash script for each job. Then your yaml file is really simple and it is easy to run the job locally, you just run the script. I used to do that. I’ve gravitated towards not doing that lately. My yaml file script sections now contain a bunch of G-CLI commands. When I want to run a particular step locally I just copy the command from the yaml file. Sometimes I have to set some environment variables before I run it. Either way you are making sure there are no errors in your bash scripting and that parameters are getting passed correctly.
Bash Scripting and YAML Interaction
I have run into some weird issues where Bash Scripting in the script section of my CI file and the YAML parsing have some weird interactions. Bash uses some weird characters and sometimes the YAML parsing throws up when it sees them. You can try to escape those characters, but it is a pain. The simple solution to that is to simply put your bash commands in a .sh file and call that from the script section of the YAML file. Then the YAML parser isn’t encountering all those weird characters.
Help!
If you are having issues using Continuous Integration or want to get started with it, but don’t know where to start, we can help. Let’s talk.
